This articles show an introduction to memory analysis in Java applications. It shows an overview of heap dump and the Eclipse MAT tool.
Java memory analysis
Throughout the application lifecycle sometimes we face problems like memory leak, or even without a manifested error, we may try to improve some non-functional feature.
Java platform provides some ways of analysing application’s memory. Coming up with one way to categorize them:
- Real time analysis
- Static analysis
In Real time analysis, it’s possible to introspect the memory as it is while the application is running. This may be achieved using JMX which is the API for management. Another way is through profiling tools like jprofiler or Appdynamics (a great one).
Static analysis is done through a snapshot of the Java heap in some moment. This is shown in this article.
Heap dumps
Heap dump refers to the action of creating the snapshot of Java heap. This process results in a binary file, which may be very big, depending on the target process’s memory. Getting that, is simple! There are a few ways:
jmap:
One of the simplest and most used ways:
jmap -dump:format=b,file=my_dump.hprof 78965
In this case, 78965 indicated the process ID in the OS.
jvisualvm:
In this way, it’s possible to do it using a GUI application. You need to have access to this process using JMX through.
- Run the application (
.{your jdk bin directory}/jvisualvm) - On the left pane, select the process
- On the right pane:
- Monitor
- Heap Dump
- On the left pane, click on the created entry, and “Save as…”
jcmd:
From Java 7 on, there is another tool. It’s said that this tool, it is faster and created dumps are smaller. (I haven’t checked it out)
jcmd 98765 GC.heap_dump /home/my_dump
Other ways of doing it are shown in this article, including one triggered automatically when an OutOfMemory occurs.
Working with the dump
Ok, now we have the data… so, how to use it?!
Eclipse MAT
Eclipse MAT is a free / open source tool based on the well-known Eclipse (oh, really?!) targeted to Java heap dump analysis. MAT stands for Memory Analyzer Tool.
Check out the project’s site
It provides a visual environment to navigate / explore the given Java heap snapshot.
Moreover, it has tools that try to figure out memory leak or possible problems automatically.
An Overview
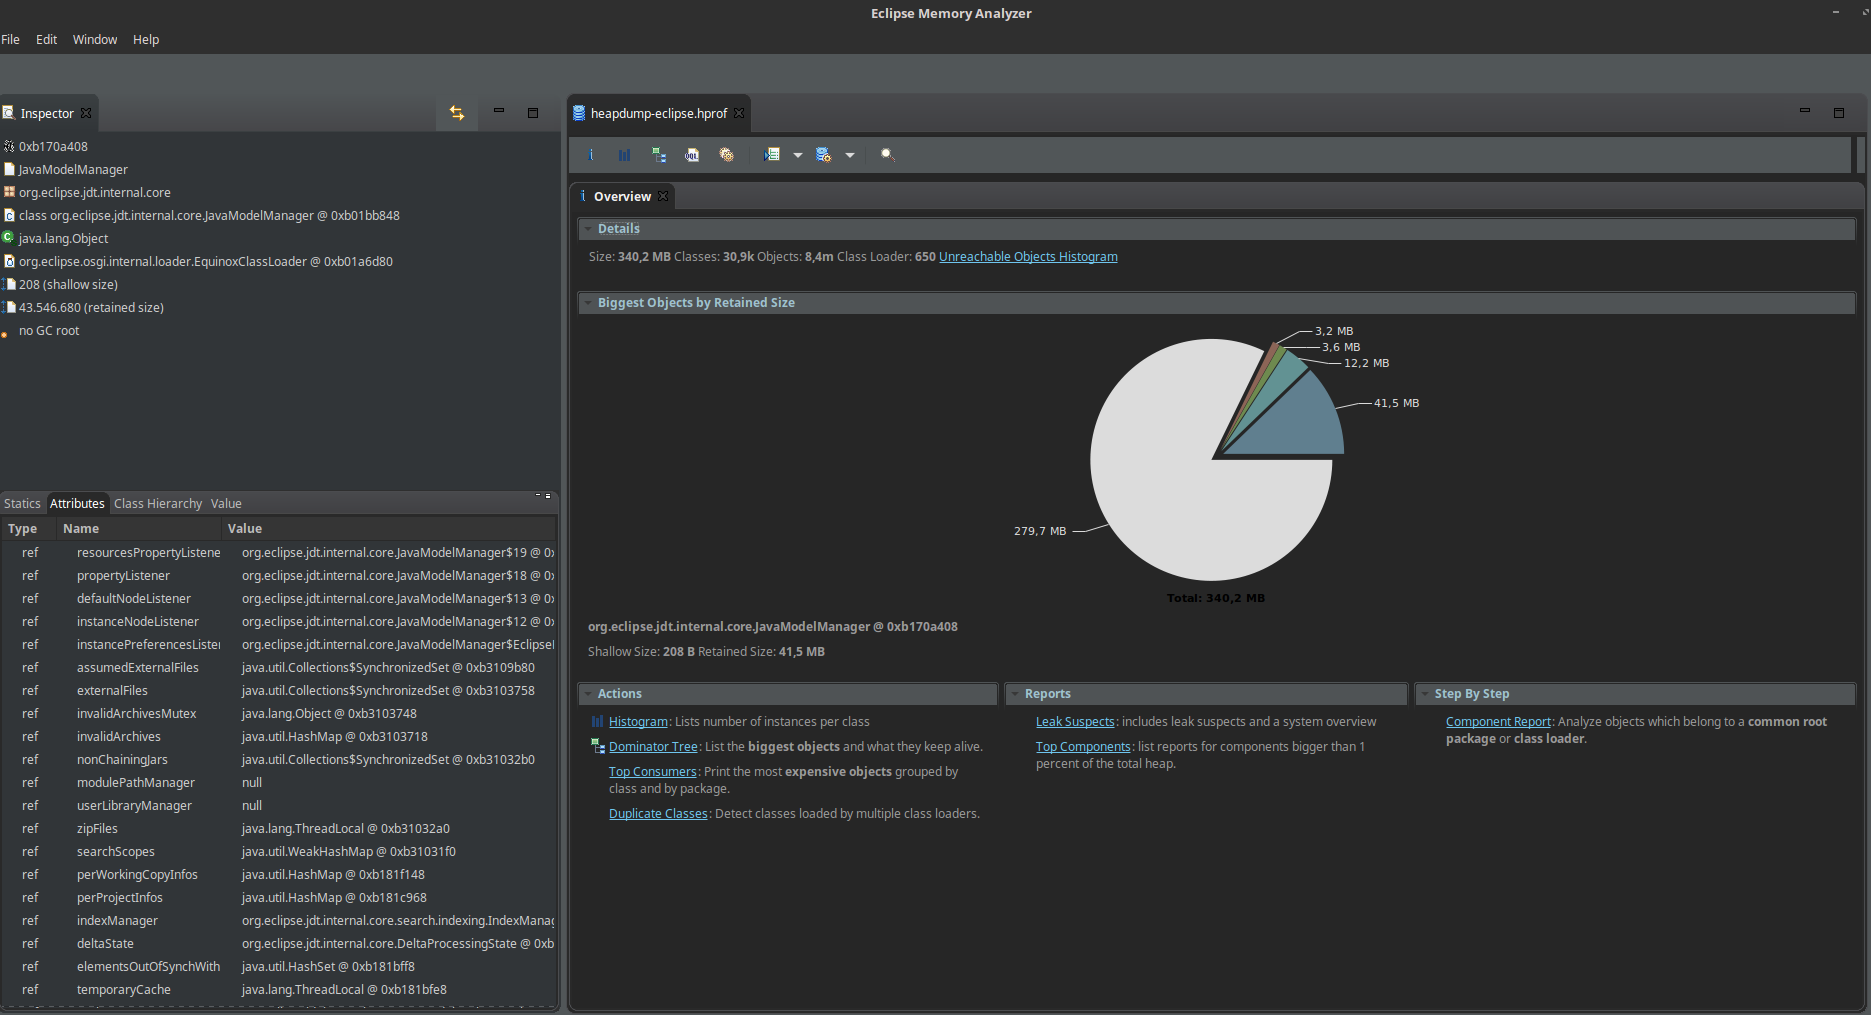
Right after the heap dump is opened, an overview of the memory is shown, in addition to available views:

Each component in Eclipse MAT shows a different view of the same general data (that is, the heap).
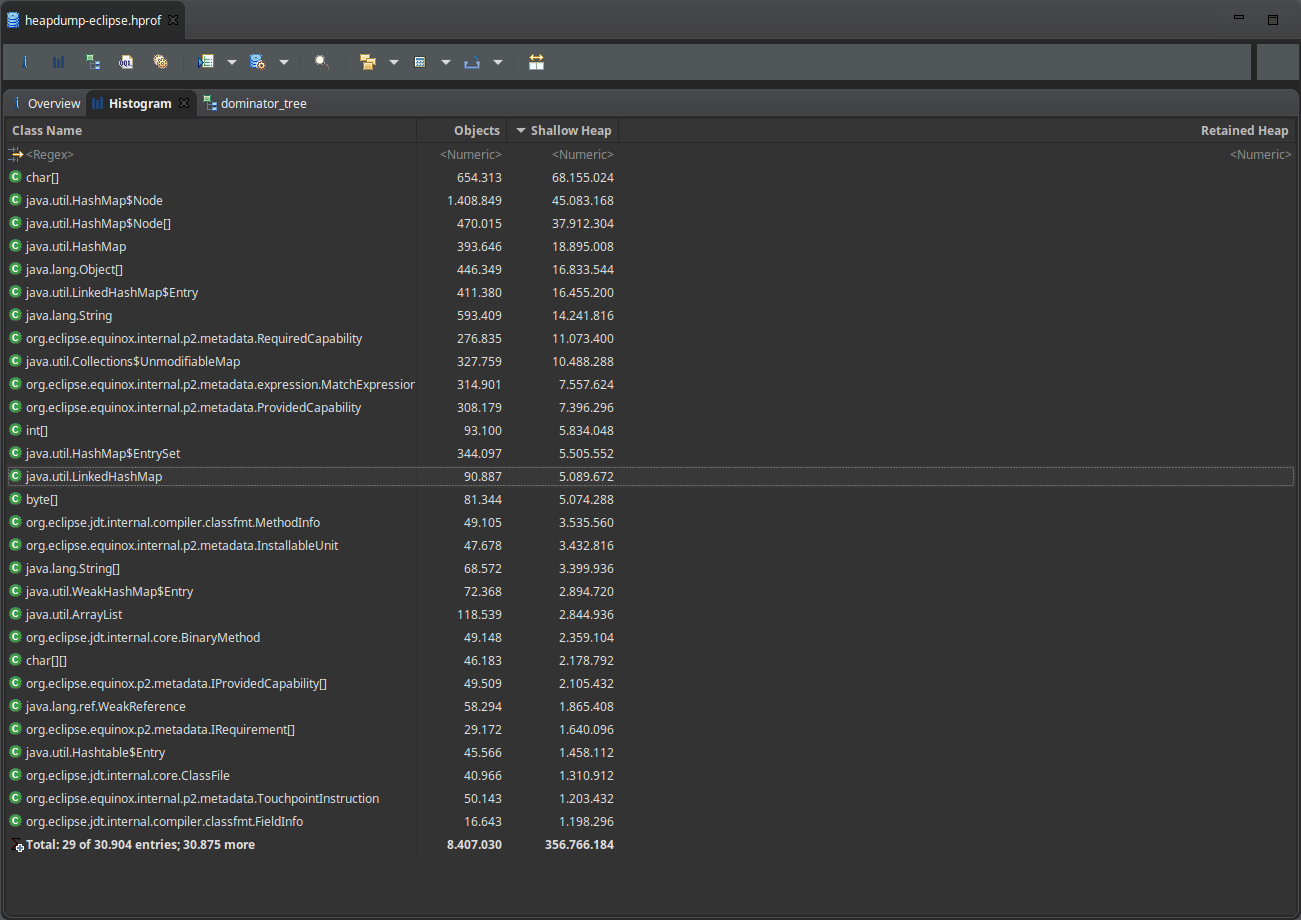
The main of them are the histogram and the dominator.
Histogram shows the number of instances (objects) and the amount of memory used (bytes) per class. In this view, data is aggregated by class.

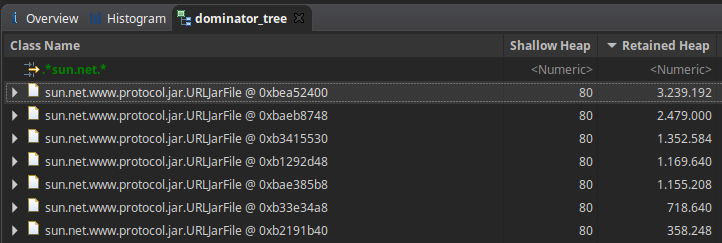
Dominator focuses on objects rather than classes. It also shows the tree, that is, the referenced objects of a given object. Using the context menu (right click), it’s possible to open other views based on the references (both incoming and outgoing) of an object, besides many other options.
In all view, it’s possible to filter the results, using a regex. This is very useful, when the grid may contain thousands of lines.

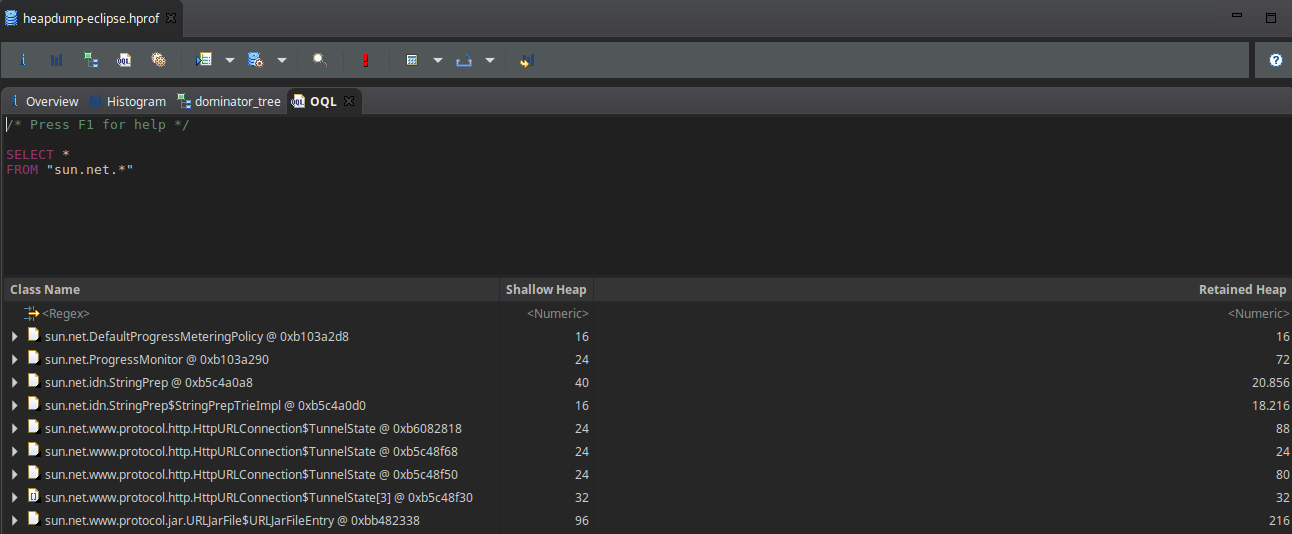
At last, another great feature is the OQL, which stands for Object Query Language. This is a SQL-like syntax that enables you to query over the heap.

That’s it, just some tips about this great tool.
!EOF
